Performance Comparison
We compared performance of the new classification algorithm and the state-of-the-art traditional algorithms AB, DT, GNB, KNN, MLP, NC, QDA, RF, SVC and XGB and incremental algorithms SFAM, HT, OB, HAT, KNNI, NB, EFDT, ARF, AEE, DWM, LVQ, LVQ2, LVQ2.1, LVQ3 and EVQ. Results are presented in separate tables for traditional and incremental algorithms because the SFAM method and algorithms from the LVQ family – with which we primarily wanted to compare the results – require normalized data. Hence, we used normalized data for testing incremental algorithms, and non-normalized data for testing traditional ones.
The average results obtained for the 36 datasets presented for each algorithm were calculated from each of the fold results on each dataset.
To date, no common consensus has emerged as to the choice of measures used to evaluate the performance of classifiers for comparison of data classification algorithms. Thus, in this study, we decided to choose the most popular measures, such as accuracy, precision, sensitivity, F1 score and AUC, to evaluate and compare classifiers.
Metrics
Table 1 and Table 2 present the average results obtained for the 36 datasets for each algorithm, calculated from each of the fold results on each dataset. Results in the tables are sorted by AUC in the descending order.
Algorithm |
AUC |
Accuracy |
Precision |
Recall |
F1 |
|
|---|---|---|---|---|---|---|
1 |
XGB |
0.840±0.149 |
0.829±0.173 |
0.831±0.175 |
0.829±0.173 |
0.822±0.182 |
2 |
MLP |
0.788±0.168 |
0.799±0.181 |
0.791±0.193 |
0.799±0.181 |
0.783±0.196 |
3 |
SEVQ |
0.787±0.165 |
0.764±0.221 |
0.779±0.211 |
0.764±0.221 |
0.763±0.222 |
4 |
GNB |
0.786±0.141 |
0.703±0.223 |
0.774±0.189 |
0.703±0.223 |
0.699±0.230 |
5 |
DT |
0.785±0.140 |
0.757±0.185 |
0.758±0.191 |
0.757±0.185 |
0.743±0.196 |
6 |
RF |
0.782±0.149 |
0.793±0.175 |
0.783±0.187 |
0.793±0.175 |
0.775±0.191 |
7 |
KNN |
0.779±0.170 |
0.776±0.205 |
0.779±0.211 |
0.776±0.205 |
0.766±0.213 |
8 |
AB |
0.751±0.150 |
0.701±0.246 |
0.681±0.270 |
0.701±0.246 |
0.675±0.271 |
9 |
SVC |
0.746±0.175 |
0.763±0.202 |
0.736±0.237 |
0.763±0.202 |
0.733±0.228 |
10 |
QDA |
0.746±0.176 |
0.675±0.284 |
0.698±0.287 |
0.675±0.284 |
0.655±0.300 |
11 |
NC |
0.716±0.145 |
0.629±0.201 |
0.700±0.194 |
0.629±0.201 |
0.632±0.201 |
Table 1. Results of a comparison of incremental algorithms.
Algorithm |
AUC |
Accuracy |
Precision |
Recall |
F1 |
|
|---|---|---|---|---|---|---|
1 |
SEVQ |
0.794±0.166 |
0.775±0.218 |
0.789±0.207 |
0.775±0.218 |
0.774±0.219 |
2 |
NB |
0.791±0.144 |
0.756±0.192 |
0.769±0.199 |
0.756±0.192 |
0.747±0.205 |
3 |
EVQ |
0.783±0.160 |
0.785±0.193 |
0.791±0.193 |
0.785±0.193 |
0.778±0.198 |
4 |
HAT |
0.780±0.159 |
0.761±0.193 |
0.750±0.217 |
0.761±0.193 |
0.741±0.213 |
5 |
SFAM |
0.779±0.155 |
0.759±0.204 |
0.779±0.196 |
0.759±0.204 |
0.757±0.205 |
6 |
HT |
0.775±0.159 |
0.762±0.192 |
0.748±0.221 |
0.762±0.192 |
0.741±0.213 |
7 |
AEE |
0.765±0.149 |
0.718±0.218 |
0.723±0.233 |
0.718±0.218 |
0.701±0.234 |
8 |
OB |
0.762±0.169 |
0.763±0.217 |
0.759±0.233 |
0.763±0.217 |
0.745±0.235 |
9 |
KNNI |
0.760±0.168 |
0.759±0.217 |
0.756±0.233 |
0.759±0.217 |
0.742±0.234 |
10 |
EFDT |
0.757±0.157 |
0.736±0.212 |
0.733±0.233 |
0.736±0.212 |
0.713±0.232 |
11 |
ARF |
0.753±0.165 |
0.717±0.242 |
0.683±0.285 |
0.717±0.242 |
0.681±0.279 |
12 |
LVQ2 |
0.750±0.160 |
0.732±0.223 |
0.726±0.237 |
0.732±0.223 |
0.715±0.240 |
13 |
LVQ |
0.738±0.166 |
0.725±0.229 |
0.710±0.254 |
0.725±0.229 |
0.699±0.255 |
14 |
LVQ2.1 |
0.736±0.167 |
0.729±0.227 |
0.707±0.266 |
0.729±0.227 |
0.699±0.260 |
15 |
DWM |
0.735±0.160 |
0.674±0.262 |
0.675±0.288 |
0.674±0.262 |
0.656±0.283 |
16 |
LVQ3 |
0.671±0.164 |
0.658±0.213 |
0.649±0.226 |
0.658±0.213 |
0.626±0.223 |
Table 2. Results of a comparison of incremental algorithms.
Given such an ordering among the traditional algorithms, XGB is the clear winner because it achieved the best results for each of the metrics. Additionally, SEVQ is the third-best for AUC and the fifth-best for accuracy. Among incremental algorithms, SEVQ achieved the best results for AUC, and was second-best for accuracy.
Ranking of the compared algorithms
For each dataset, the means of AUC and accuracy for the 10 folds were calculated both for traditional and incremental algorithms. The algorithm with the highest average value was ranked first. The counts of wins and the instances of placing second and third are presented in Tables 3 and 4.
Algorithm |
AUC 1st |
AUC 2nd |
AUC 3rd |
ACC 1st |
ACC 2nd |
ACC 3rd |
|
|---|---|---|---|---|---|---|---|
1 |
XGB |
7 |
9 |
3 |
8 |
8 |
4 |
2 |
AB |
6 |
0 |
5 |
6 |
1 |
3 |
3 |
SEVQ |
4 |
6 |
1 |
4 |
3 |
2 |
4 |
GNB |
4 |
4 |
3 |
4 |
0 |
1 |
5 |
SVC |
4 |
1 |
5 |
6 |
0 |
7 |
6 |
NC |
4 |
1 |
0 |
1 |
1 |
0 |
7 |
MLP |
3 |
4 |
8 |
4 |
5 |
9 |
8 |
QDA |
2 |
2 |
4 |
1 |
2 |
5 |
9 |
KNN |
1 |
4 |
2 |
1 |
4 |
1 |
10 |
RF |
1 |
2 |
4 |
1 |
6 |
3 |
11 |
DT |
0 |
3 |
1 |
0 |
6 |
1 |
Table 3. Ranking of compared traditional algorithms.
Among the traditional algorithms, XGB won most often. SEVQ took the third place in this ranking.
Algorithm |
AUC 1st |
AUC 2nd |
AUC 3rd |
ACC 1st |
ACC 2nd |
ACC 3rd |
|
|---|---|---|---|---|---|---|---|
1 |
SEVQ |
6 |
6 |
2 |
5 |
6 |
2 |
2 |
EVQ |
4 |
6 |
2 |
6 |
3 |
3 |
3 |
AEE |
4 |
5 |
1 |
5 |
1 |
1 |
4 |
SFAM |
4 |
3 |
5 |
3 |
4 |
5 |
5 |
ARF |
4 |
1 |
2 |
7 |
1 |
2 |
6 |
DWM |
3 |
2 |
3 |
3 |
1 |
2 |
7 |
HAT |
3 |
2 |
3 |
1 |
0 |
4 |
8 |
OB |
2 |
3 |
4 |
2 |
4 |
4 |
9 |
EFDT |
2 |
3 |
4 |
1 |
7 |
1 |
10 |
NB |
1 |
2 |
2 |
0 |
2 |
1 |
11 |
KNNI |
1 |
1 |
3 |
0 |
2 |
6 |
12 |
LVQ2.1 |
1 |
1 |
0 |
2 |
1 |
0 |
13 |
LVQ2 |
1 |
0 |
2 |
0 |
1 |
2 |
14 |
LVQ |
0 |
1 |
1 |
1 |
2 |
0 |
15 |
HT |
0 |
0 |
2 |
0 |
1 |
2 |
16 |
LVQ3 |
0 |
0 |
0 |
0 |
0 |
1 |
Table 4. Ranking of compared incremental algorithms.
Among the incremental algorithms, SEVQ scored the highest number of wins due to the highest AUC on 6 datasets and due to the highest accuracy on 5 datasets among incremental algorithms, surpassing even SFAM, LVQ, LVQ2, LVQ2.1 and LVQ3.
Means of accuracy and AUC
We also compared the results of the traditional algorithms and SEVQ using box plots. A box plot is a standardized type of chart often used in explanatory data analysis. Such a plot can be used to visualize the distribution of numerical data and skewness by displaying the data quartiles and averages. A box plot shows the summary of a set of data, including the minimum score, the lower quartile, the median, the upper quartile and the maximum score. An outlier in a box plot is an observation that is numerically distant from the rest of the data. When a box plot is analyzed, an outlier is defined as a data point located outside the whiskers of the box plot.
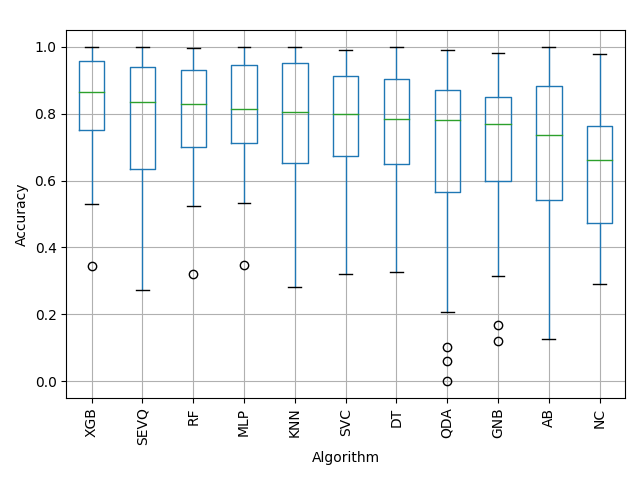
Figure 1. Distribution of ACC values for each traditional algorithm across all datasets.
Figure 1 presents a box plot of accuracy for each traditional algorithm across 36 datasets subjected to 10-fold cross-validation. The box plots are arranged in the descending order of medians of accuracy. SEVQ is in the second position among all traditional algorithms tested for accuracy; in other words, it is a good algorithm for general usage. It only loses to the XGB algorithm, which has become the best non-incremental algorithm for winning competitions at Kaggle because it is extremely powerful. The plot also shows several outliers that lower the average results of the algorithm and its position in Table 1 and 3.
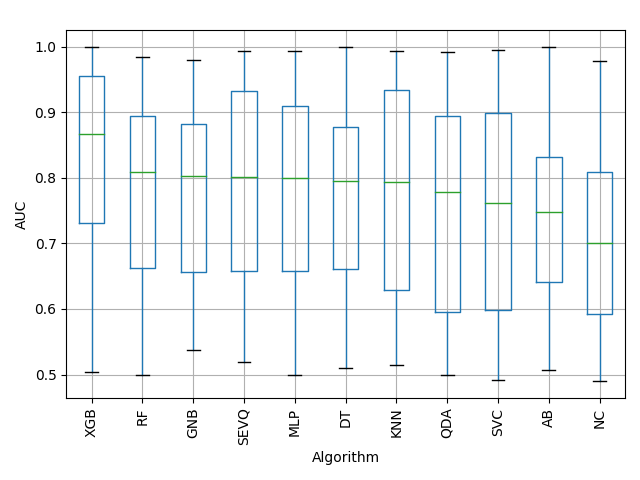
Figure 2. Distribution of AUC values for each traditional algorithm across all datasets.
Figure 2 shows a box plot of AUC for each of the traditional algorithms arranged in the descending order of medians of AUC. SEVQ, as before, is in the second position, and again only loses to the XGB algorithm.
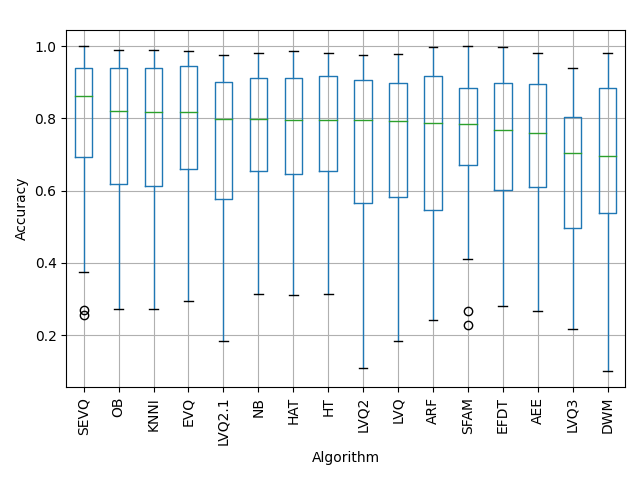
Figure 3. Distribution of ACC values for each incremental algorithm across all datasets.
Figure 3 presents a box plot of accuracy arranged in the descending order of medians of accuracy. SEVQ is in the first position among all incremental algorithms tested for accuracy. The plot also shows several outliers that lower the average results of the algorithm and its position in Tables 2 and 4.
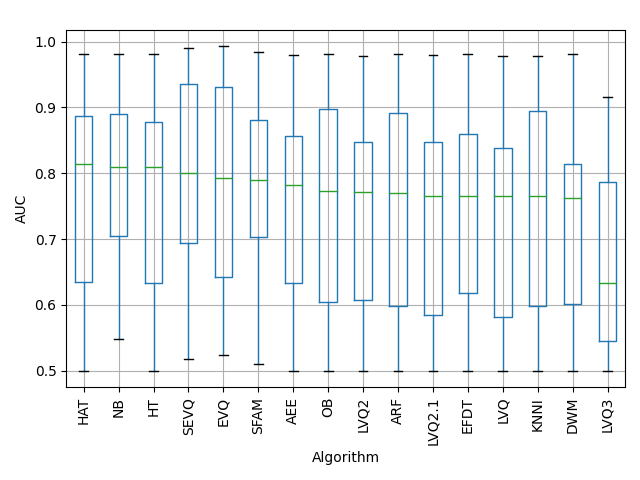
Figure 4. Distribution of AUC values for each incremental algorithm across all datasets.
Figure 4 shows a box plot of AUC for each of the incremental algorithms arranged in the descending order of medians of AUC. SEVQ, as before, is in the first position.